
Module 1 · Demand & Supply
Demand & Supply Zones
How the engine identifies institutional footprints on Indian equities and indices.
Candle classification
Every chart is a sequence of candles. The engine categorises them into two simple buckets before any zone is even considered. This is the first filter applied to NSE F&O symbols every session.
A candle with a body much larger than its wick range — a decisive move that suggests institutional participation in that direction.
A candle with a small body relative to its range — balance, indecision or quiet accumulation before the next decisive move.
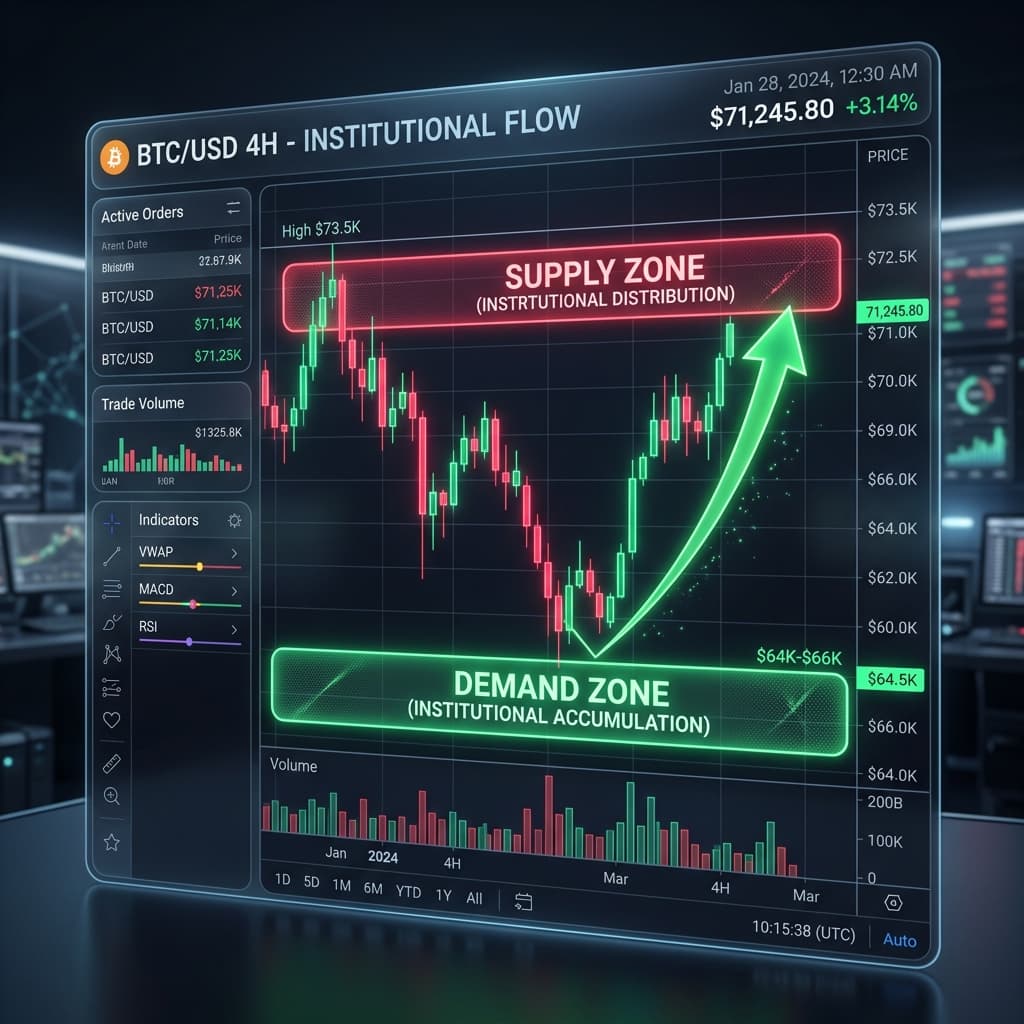
What is a zone?
A Demand Zone is an area where buying interest previously overwhelmed selling. It is typically formed by a string of base candles followed by a strong explosive bullish candle. The engine marks the proximal (near-price) and distal (far-price) boundaries of the base.
When price returns to that zone, unfilled institutional orders often remain and can trigger another reaction. The mirror logic holds for a Supply Zone.
What multiplies a zone’s ranking
- Freshness. A zone that has not been re-tested has more unfilled orders and therefore more potential to react.
- Departure strength. The stronger the explosive candle leaving the base, the higher the engine ranking.
- Trend confluence. A demand zone inside a higher-timeframe uptrend receives the highest weighting.
Ready to see it in the preview?
Open the Demand & Supply page to see today’s read-only cloud-safe mirror of the engine output.